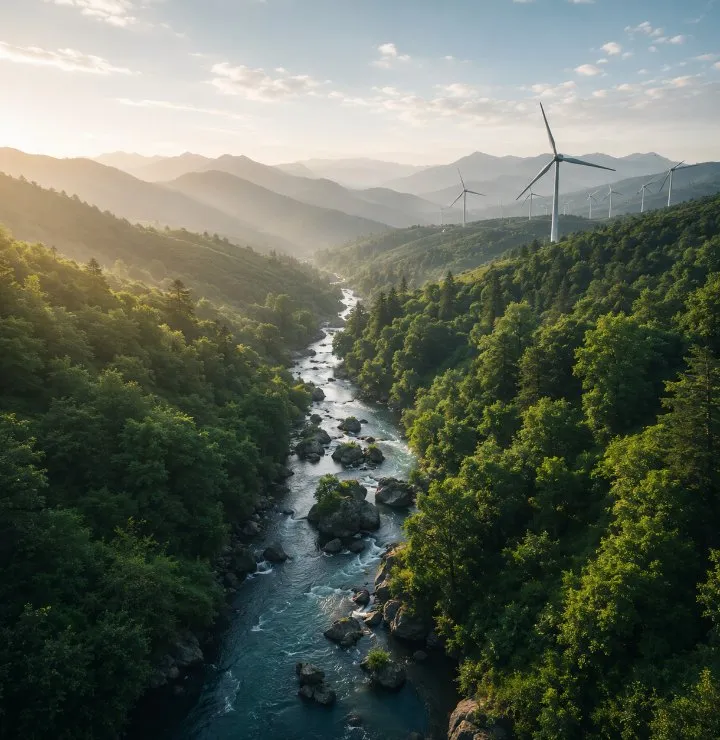
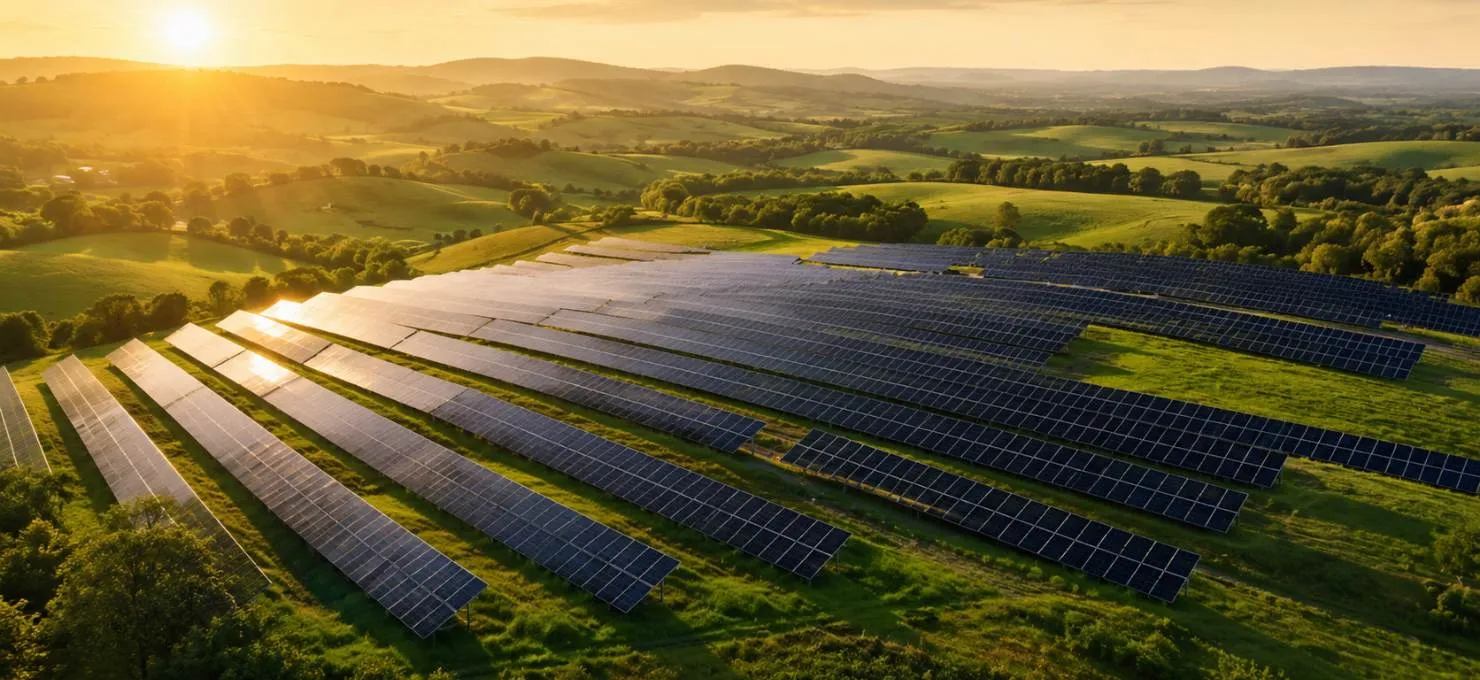


3.1GW
Built to date
Capabilities
Each one is run by people who have operated the asset class, not advised on it.
Built to date
Installed
Contracted
260
Studies filed
Track record
Commissioned capacity, by year of grid connection.
2019
2020
2021
2022
2023
2024
2025
Where we operate
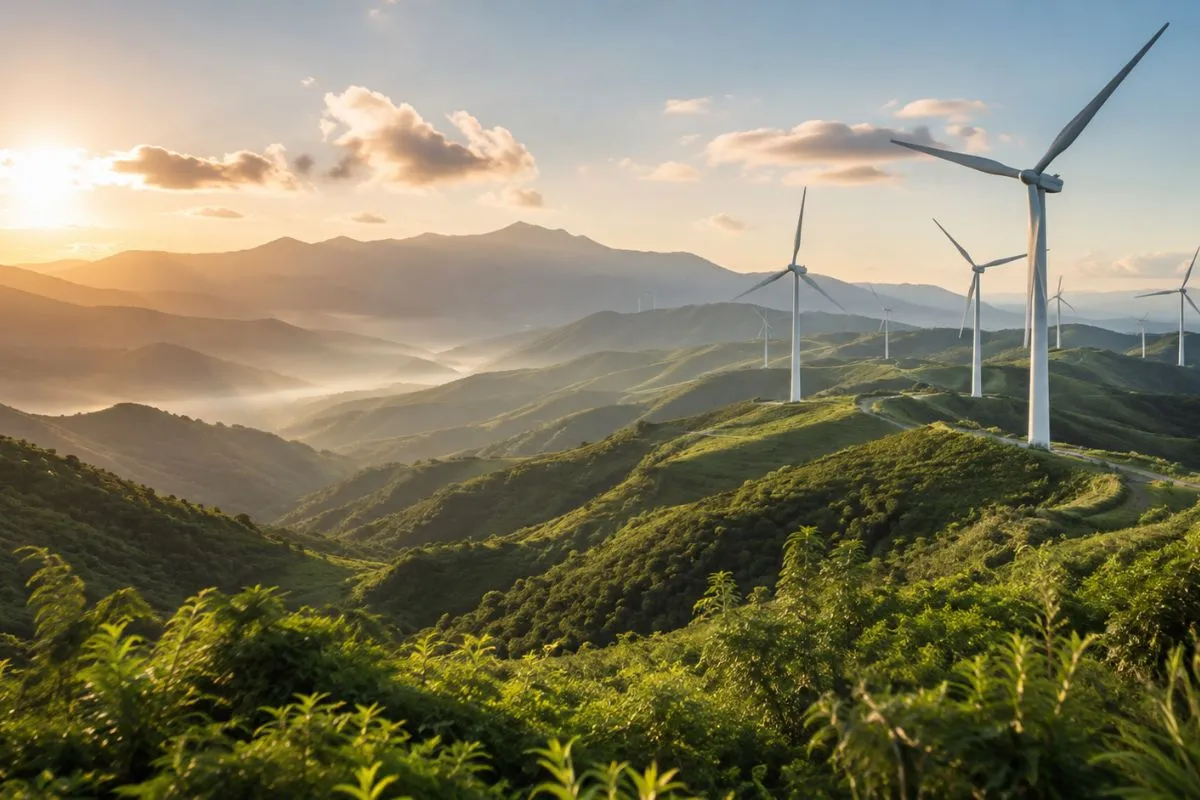
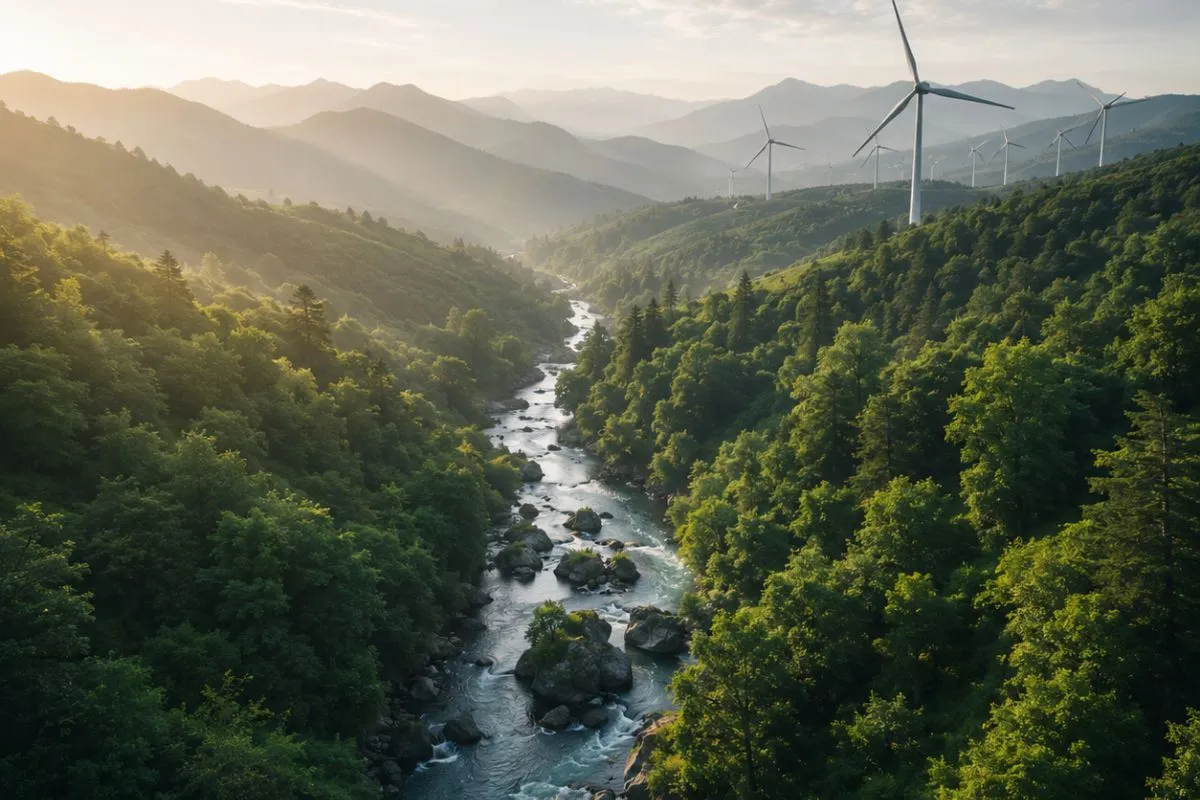
Scotland
 01Onshore wind and grid
Europe’s densest onshore wind resource, and a transmission queue that decides how much of it ever reaches a customer.
1.4 GW

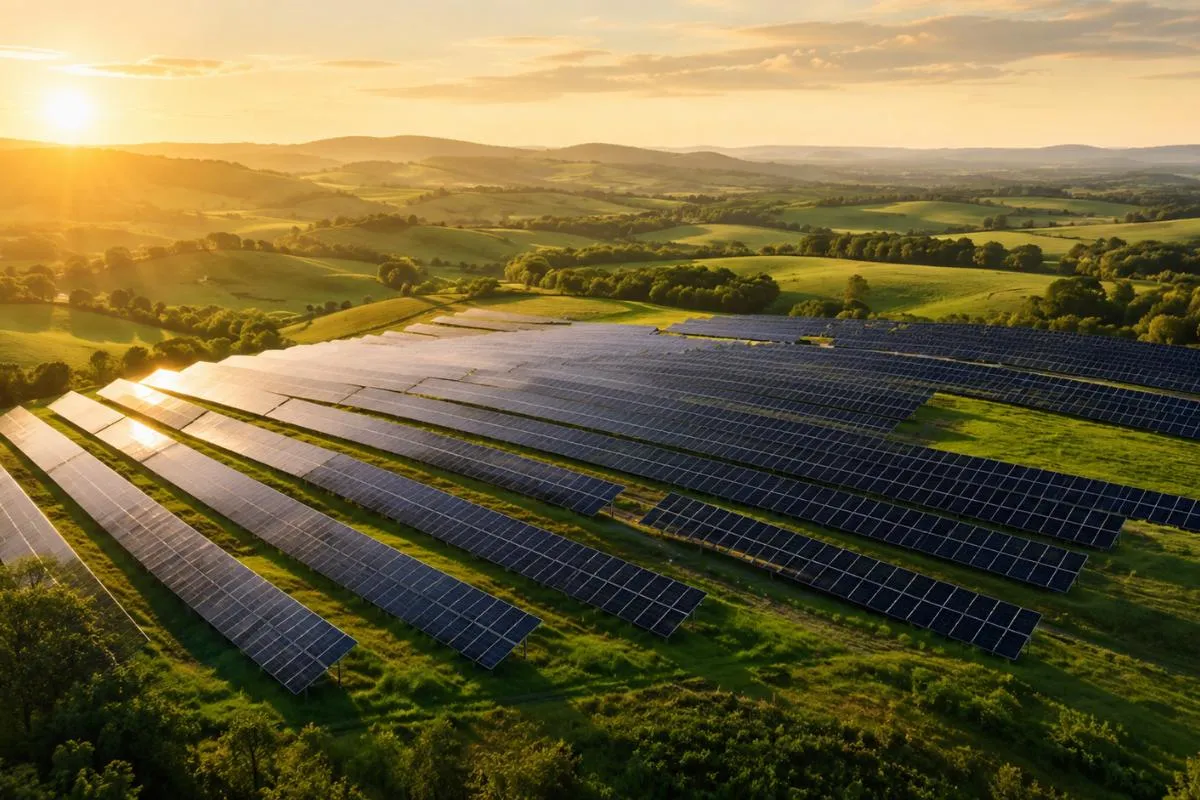
North England
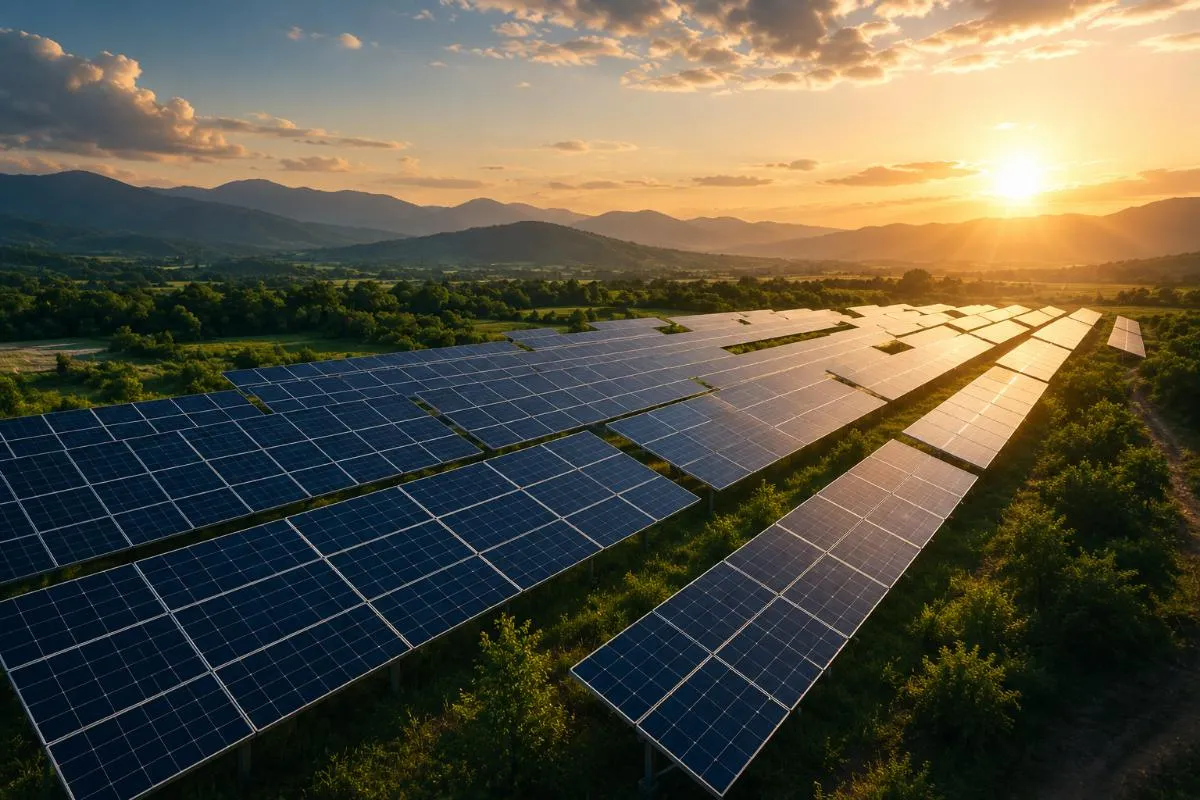
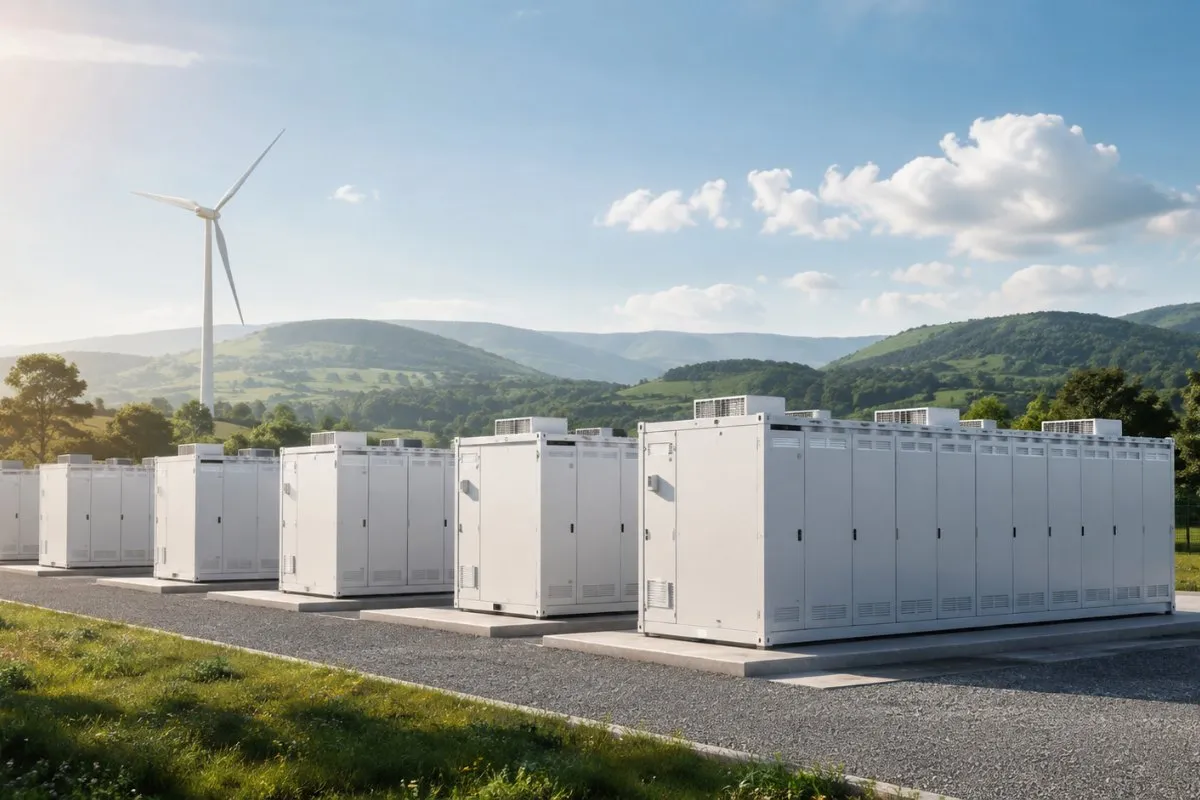
 02Solar and co-located storage
Flat ground, short grid runs and the demand sitting next to it — the cheapest megawatt we build anywhere.
780 MW
Wales
 03Consented pipeline
Consent won, construction not started. The part of the book that is already de-risked and not yet earning.
410 MW
Ireland
 04Origination and advisory
We own nothing here. We find the ground, carry it through consent, and hand it to the utility that will hold it.
520 MW



How an asset gets built
01 — Origination
Before anyone owns anything we stake the ground, measure the resource and read the interconnection queue. Most sites die here, and that is the cheapest place for them to die.
Months 0–14
02 — Consent
Environmental assessment, community consultation, determination. The slowest stage every time, and the one where the objections that matter are never the ones a comms plan was written for.
Months 10–30
03 — Build
Procurement, civils and grid works run in parallel on a schedule the network operator sets, not the contractor. This is the visible part, and it is the shortest.
Months 24–42
04 — Operate
Dispatch, availability, curtailment and the monthly report against the original case. We hold the asset, so this is the stage that pays for every decision taken in the first three.
Year 4 onward
Send us the constraint. We will tell you within a fortnight whether it is buildable and what it would take.